Despite the challenging operating environment, BlueShore delivered healthy results in 2022. We remained committed to our clients and staff, providing premium service and expert financial advice to help our clients achieve financial wellness. Net operating income decreased to $19.3 million (2021, $42.0 million), primarily due to the unfavourable impact of rising rates on net interest income and our provision for credit losses. Return on retained earnings was 7.3% (2021, 17.8%). These results are in line with a return to pre-pandemic levels of profitability following an unusually favourable operating environment in 2020 and 2021, as the Bank of Canada reduced its overnight rate sharply by 150 bps to 25bps in 2020 and held it at that level through to the end of 2021 (average net operating income from 2015 to 2019, $18.3 million; average return on retained earnings from 2015 to 2019, 11.5%).
| (in thousands of dollars) | 2022 | 2021 | Change ($) | Change (%) |
|---|---|---|---|---|
| Interest Income | ||||
| Interest from loans and advances to members | ||||
| Residential and personal interest income | 84,372 | 75,097 | 9,275 | 12.4% |
| Commercial and leasing interest income | 73,668 | 66,611 | 7,057 | 10.6% |
| Investment Interest Income | 8,104 | 2,789 | 5,315 | 190.5% |
| Net interest income and gains on derivative financial instruments |
- | 7,879 | (7,879) | (100.0%) |
| Other interest income | 723 | 1,431 | (709) | (49.5%) |
| 166,867 | 153,807 | 13,060 | 8.5% | |
| Interest Expense | ||||
| Interest on members' deposits | 72,916 | 48,863 | 24,053 | 49.2% |
| Interest on borrowed funds | 9,840 | 5,347 | 4,493 | 84.0% |
|
Net interest expenses and losses |
683 | - | 683 | N/A |
| Deposit agent commissions | 45 | 779 | (734) | (94.3%) |
| 83,484 | 54,989 | 28,495 | 51.8% | |
| Net Interest Income | 83,383 | 98,818 | (15,435) | (15.6%) |
| 2022 | 2021 | Change (%) | ||
| Average loan yield (%) | 3.54% | 3.33% | 0.21% | |
| Average deposit cost (%) | 1.58% | 1.12% | 0.46% | |
| Net interest income (%) | 1.60% | 2.00% | (0.40%) |
Net interest income, defined as interest and investment income earned on assets less interest expense on deposits and borrowings, decreased $15.4 million or 15.6%, to $83.4 million from $98.8 million.
Interest rates rose steeply in 2022 as the Bank of Canada tightened monetary policy and increased the overnight by 400bps. The rising rate environment created significant margin compression, as interest expense from deposits and borrowings increased more than interest income from loans and investments. The shorter duration of our deposits relative to our loans resulted in average deposit costs increasing by 46bps, compared to a 21bps increase in average loan yields. As a result, net interest income decreased by 40bps.
| (in thousands of dollars) | 2022 | 2021 | Change ($) | Change (%) |
|---|---|---|---|---|
| Fee and commission income | ||||
| Account services fees | 3,713 | 3,140 | 573 | 18.2% |
| Commission | 12,332 | 11,913 | 419 | 3.5% |
| Lending charges | 5,188 | 8,726 | (3,538) | (40.5%) |
| 21,233 | 23,779 | (2,546) | (10.7%) | |
| Other income: | ||||
| Other member and miscellaneous | 779 | 691 | 88 | 12.7% |
| 779 | 691 | 88 | 12.7% | |
| Total fee, commission and other income | 22,012 | 24,470 | (2,458) | (10.0%) |
BlueShore’s total fee, commission and other income decreased $2.5 million or 10.0% to $22.0 million in 2022.
Fee and commission income decreased $2.5 million or 10.7% in 2022. The rising rate environment coupled with the slowdown in the Greater Vancouver housing market resulted in a $3.5 million or 40.5% reduction in lending charges. This was partially offset by a $0.6 million or 18.2% increase in account service fees and a $0.4 million or 3.5% increase in commission income from strong investment net asset and insurance sales.
| Non-Interest Expenses (in thousands of dollars) |
2022 |
2021 |
Change ($) |
Change (%) |
| Salary and employee benefits | ||||
| Salaries, commissions and bonuses | 44,566 | 43,536 | 1,030 | 2.4% |
| Benefits | 4,264 | 3,879 | 385 | 9.9% |
| Pension costs | 3,907 | 3,990 | (83) | (2.1%) |
| 52,737 | 51,405 | 1,332 | 2.6% | |
| General and administrative expenses | 23,299 | 22,822 | 477 | 2.1% |
| Building and occupancy | ||||
| Amortization | 6,268 | 6,919 | (651) | (9.4%) |
| Occupancy | 3,277 | 2,885 | 392 | 13.6% |
| 9,545 | 9,804 | (259) | (2.6%) | |
| Non interest expenses | 58,581 | 84,031 | 1,550 | 1.8% |
| 2022 | 2021 | Change (%) | ||
| Operating efficiency | 81.2% | 68.2% | 13.0% |
Non-interest expenses grew $1.6 million or 1.8% to $85.6 million in 2022.
Salaries and benefit expenses increased $1.3 million or 2.6% as we continued our commitment to delivering exceptional client service by increasing our investment in our employees. This included increasing staffing levels to 405 employees in 2022. Higher commission expenses reflect the growth in our Wealth Management business.
General and administrative expenses increased slightly by $0.5 million or 2.1% as BlueShore continued to invest in technology to enhance our digital client experience and to meet the ambitious targets in our long-term strategic plan. This will continue to be a key area of investment in the future as we enhance our high-tech, high-touch approach.
Operating efficiency increased to 81.2% in 2022, compared to 68.2% in 2021. Operating efficiency measures how much BlueShore spends in order to earn income. Specifically, it calculates non-interest expenses as a percentage of total income (excluding provision for credit losses). This decrease in operating efficiency is primarily due to the decrease in our interest income described above. Management will continue to focus on balancing careful expense management with our commitment to delivering exceptional service and our ability to deliver on our long-term strategy.
Note 11 of the consolidated financial statements provides a complete analysis of our capital expenditures and dispositions.
| (in thousands of dollars) | 2022 | 2021 | Change ($) | Change (%) |
| Residential mortgages and consumer loans | 2,874,001 | 2,765,093 | 108,908 | 3.9% |
| Commercial loans and finance leases | 1,684,977 | 1,649,741 | 35,236 | 2.1% |
| Total loans* | 4,558,978 | 4,414,834 | 144,144 | 3.3% |
*Balances exclude accrued interest. allowance for credit losses, broker and commitment fees
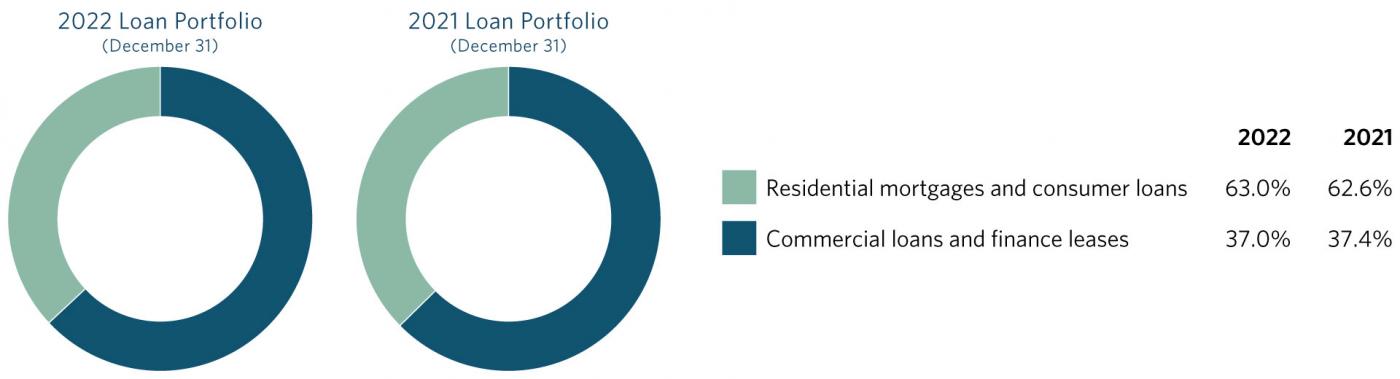
BlueShore’s loan portfolio increased by $144.1 million to $4.56 billion, up from $4.41 billion at the end of 2021. Despite the slowdown in the Greater Vancouver real estate market, we supported our clients in their personal and business goals and delivered growth across our portfolio.
Residential mortgages and consumer loans comprise 63.0% of BlueShore’s loan portfolio, up from 62.6% in 2021, reflecting faster relative growth in this category. Residential mortgages and consumer loans increased by $108.9 million or 3.9% to $2.87 billion in 2022. Commercial loans and leases make up the remaining 37.0% of our loan portfolio, down slightly from 37.4% in 2021. Commercial loans and leases grew $35.2 million or 2.1% in 2022 to $1.68 billion, up from $1.65 billion at the end of 2021.
|
Credit Performance |
2022 | 2021 | Change ($) | Change (%) |
|---|---|---|---|---|
| Total loans | 4,558,978 | 4,414,834 | 144,144 | 3.3% |
| Provision for (recovery of) credit losses | 539 | (2,725) | 3,264 | (119.8%) |
| Net write-offs | 58 | 58 | - | 0.0% |
| Total allowance for credit losses | 11,965 | 11,484 | 481 | 4.2% |
| 2022 | 2021 | Change (%) | ||
| Provision for (recovery of) credit losses as % of average loans |
0.01% |
(0.06%) |
0.07% |
|
| Net write-offs as % of total loans | 0.00% | 0.00% | (0.00%) | |
| Total allowance for credit losses as % of total loans | 0.26% | 0.26% | 0.00% |
Total and average loans balance excludes accrued interest, allowance for credit losses, and deferred broker and mortgage fees.
Despite a deteriorating economic and credit outlook, we ended the year with our allowance for credit losses at 0.26% which is close to historical norms. The unfavourable impact of rising interest rates on macroeconomic forecasts and expected delinquencies on our expected credit loss model was offset by favourable changes in our credit portfolio.
Reflecting the growth in our loan portfolio, our allowance for credit losses increased $0.5 million or 4.2% to $12.0 million. Net write-offs remained low at $0.1 million. The allowance for credit losses is adequate based on our analysis of the loan portfolio as of December 31, 2022. Note 9 of the consolidated financial statements provides a complete analysis of our allowance for credit losses.
Under the Financial Institutions Act (FIA), credit unions are required to maintain liquid assets of not less than 8.0% of their aggregate deposit and other debt liabilities. BlueShore’s operating liquidity of 14.6% at the end of 2022 remains healthy and is comfortably above the statutory requirement. Additionally, BlueShore maintains significant contingent liquidity in the form of available borrowing facilities. For additional details, see Note 15 to the consolidated financial statements.
BlueShore maintains its statutory liquidity requirement by investing directly in marketable securities that qualify as high quality liquid assets (HQLA). The HQLA are held in a trust, with BlueShore the beneficiary, Central 1 the trustee, and Credential Qtrade Securities Inc. the investment manager.
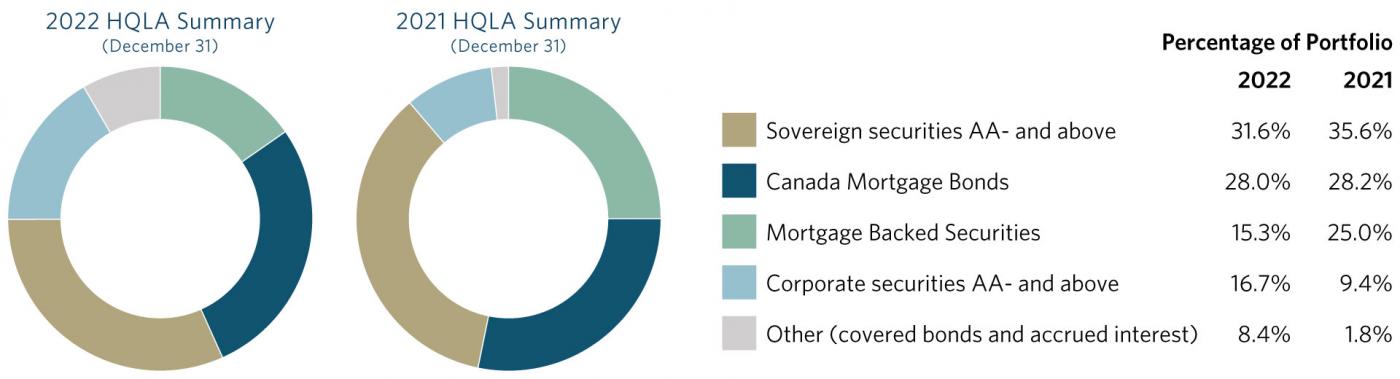
The chart above provides a breakdown of the HQLA held within the trust on behalf of BlueShore. HQLA can be easily and immediately converted into cash at little or no loss of value.
| Regulatory Capital (in thousands of dollars) |
2022 | 2021 | Change ($) | Change (%) |
|---|---|---|---|---|
| Regulatory capital | ||||
| Total primary capital | 319,996 | 303,967 | 16,029 | 5.3% |
| Total secondary capital | 73,289 | 73,451 | (162) | (0.2%) |
| Deductions from capital | (7,670) | (7,320) | (350) | 4.8% |
| Capital base | 385,615 | 370,098 | 15,517 | 4.2% |
| Total risk weighted assets | 2,739,503 | 2,708,960 | 30,543 | 1.1% |
| 2022 | 2021 | Change(%) | ||
| Capital adequacy ratio | 14.1% | 13.7% | 0.4% |
As of December 31, 2022, BlueShore had a strong capital adequacy ratio of 14.1%, up from 13.7% in 2021. The capital adequacy ratio is calculated by dividing the capital base, which includes primary and secondary capital net of deductions, by risk weighted assets, which are determined by BCFSA’s prescribed rules relating to on and off-balance sheet exposures to weighted assets according relative risk.
Primary capital is comprised of the more permanent components of capital and consists primarily of retained earnings and equity shares. Secondary capital consists primarily of subordinated debt and system retained earnings. The Credit Union’s capital ratio and capital base were in compliance with both the regulatory and supervisory requirements at all times in 2022 and 2021.
BlueShore accreted $15.5 million or 4.2% to our capital base in 2022. Primary capital growth of $16.0 million consisted primarily of retained earnings growth from profitable operations as well as equity share growth from net sales and dividend reinvestments. Risk weighted assets increased $30.5 million, due to growth in liquidity & other investments as well as our steady commercial loan growth. The increase in our capital ratio reflects faster growth in our capital base than our risk weighted assets.
| Member Deposits (in thousands of dollars) |
2022 | 2021 | Change ($) | Change (%) |
|---|---|---|---|---|
| Demand deposits | 881,551 | 941,478 | (59,927) | (6.4%) |
| Term deposits | 3,291,229 | 3,178,586 | 112,643 | 3.5% |
| Registered deposits | 433,969 | 431,367 | 2,602 | 0.6% |
| Accrued Interest and dividends payable | 43,229 | 28,086 | 15,143 | 53.9% |
| Member Deposits | 4,649,978 | 4,579,517 | 70,461 | 1.5% |
Deposits totaled $4.6 billion as of December 31, 2022, an increase of $70.5 million or 1.5% compared to the prior year. Term deposit growth of $112.6 million or 3.5% drove the overall growth in deposits, partially offset by demand deposit runoff of $59.9 million or 6.4%.
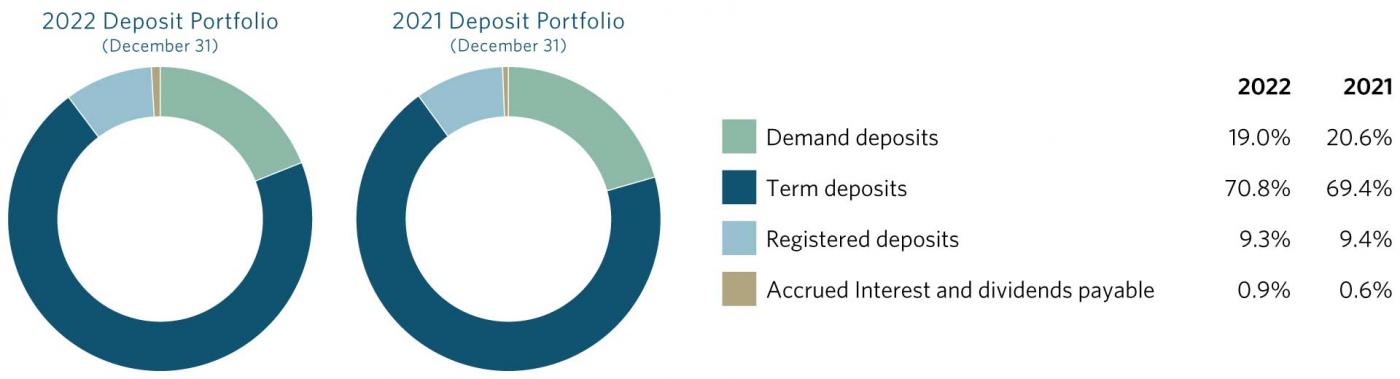
The composition of BlueShore’s deposit portfolio shifted in 2022 as demand balances, which increased significantly due to the pandemic, began to return to historical averages as consumer spending and term deposit rates increased. Demand deposits comprised 19.0% of our portfolio at the end of 2022, down from 20.6% at the end of 2021, while term deposits increased to 70.8% of our deposit portfolio.